Physical Address
304 North Cardinal St.
Dorchester Center, MA 02124
Physical Address
304 North Cardinal St.
Dorchester Center, MA 02124


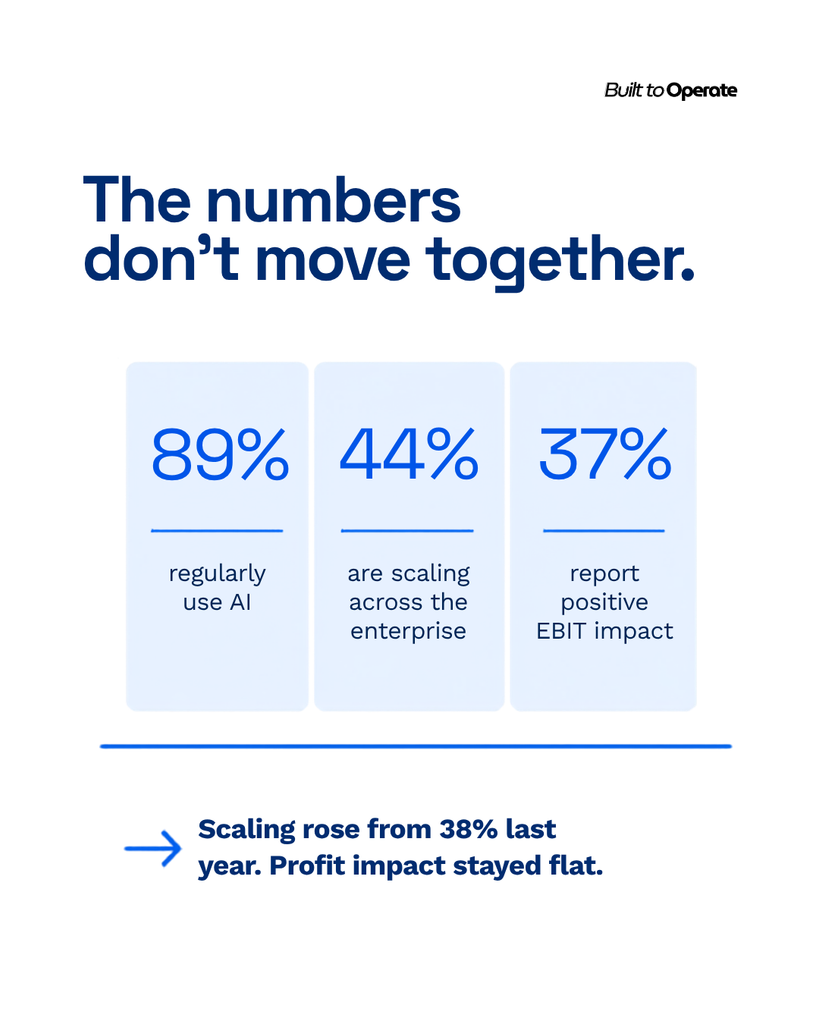
McKinsey’s 2026 State of AI survey, published August 25th and covering 1,719 business leaders, found that 89% of organizations now use AI regularly and 44% are scaling it across the enterprise, up from 38% a year ago. The share reporting any positive impact on EBIT, earnings before interest and taxes, sat at 37%. Also unchanged from last year. Not up. Not down. Flat.
That’s the whole story, and it’s worth sitting with for a second before reaching for an explanation. Usage climbed. Scaling climbed six points in a single year. The number that actually matters to a CFO didn’t move at all.
Individually, none of these figures are surprising anymore; most operators have felt this coming for a year or two. Together, they draw a sharper picture than any one of them does alone.
Eighty percent of respondents report AI has made them personally more productive. Fifty-six percent say it’s used in at least three business functions, up from 51%. And large enterprises, organizations with more than a billion dollars in annual revenue, are moving fastest: 54% report enterprise-wide scaling, against roughly a third of smaller organizations, and 40% of them are now scaling AI agents specifically, up from 27% last year (all figures from McKinsey’s 2026 survey).
Set against that: only 6% of organizations qualify as what McKinsey calls “AI high performers,” attributing more than 5% of EBIT to AI with a clearly identified mechanism. That figure hasn’t moved either. Spending is accelerating. The share of companies who can point to a real number and say “this is what AI did for our bottom line” is stuck exactly where it was.
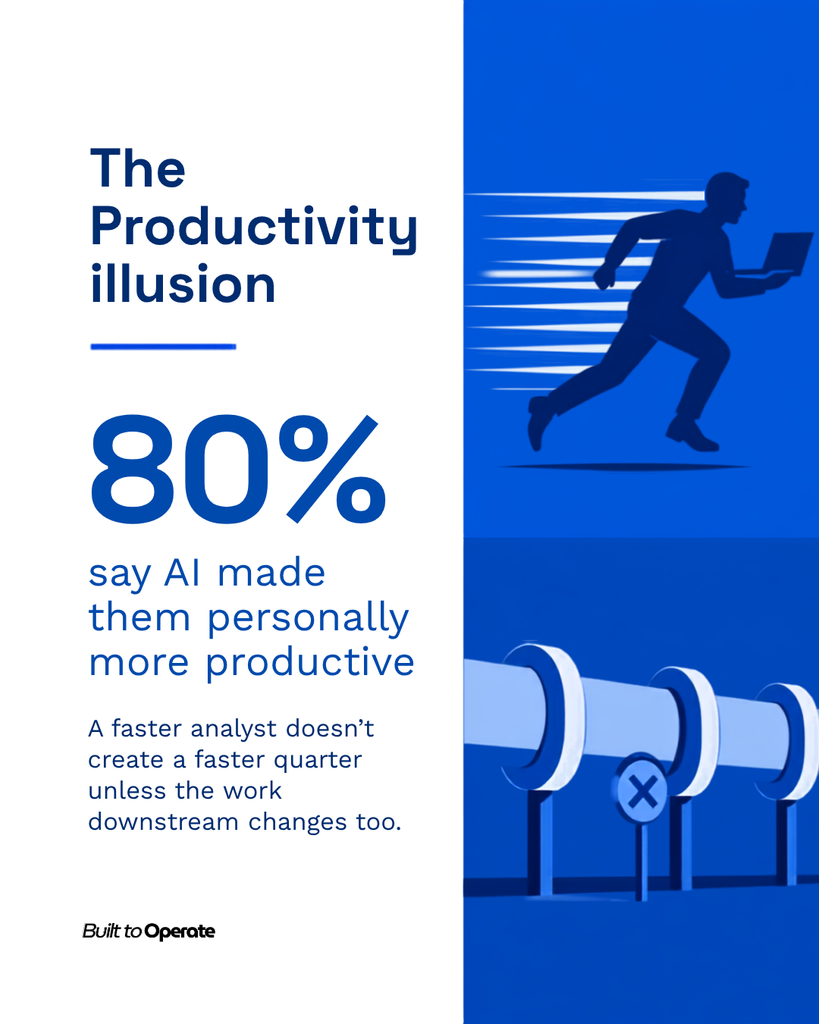
Here’s the trap in that 80% productivity figure, and it’s an easy one to fall into because the feeling is genuine. Individual productivity gains are real, widely reported, and consistent across survey waves. They just don’t automatically add up to an organizational result.
A faster analyst doesn’t produce a faster quarter unless the work downstream of that analyst changes too. A support agent handling more tickets per hour doesn’t move a P&L line unless staffing, routing, and cost structure actually adjust around that new capacity. The individual and the organization are two different units of measurement, and 2026’s data is the clearest evidence yet that treating them as interchangeable is where a lot of AI budget quietly disappears. Even the build-versus-buy shift shows this pattern: 32% of respondents say agentic coding tools have led them to build software in-house instead of buying it, which is a real behavioral change, and still, on its own, an input rather than a bottom-line result.
Curious about where this piece fits into a broader operating model, not just a single metric? The Enterprise AI Operating Model Blueprint is free and lays out the six layers, strategy through performance measurement, that connect individual AI use to something a board can actually see.
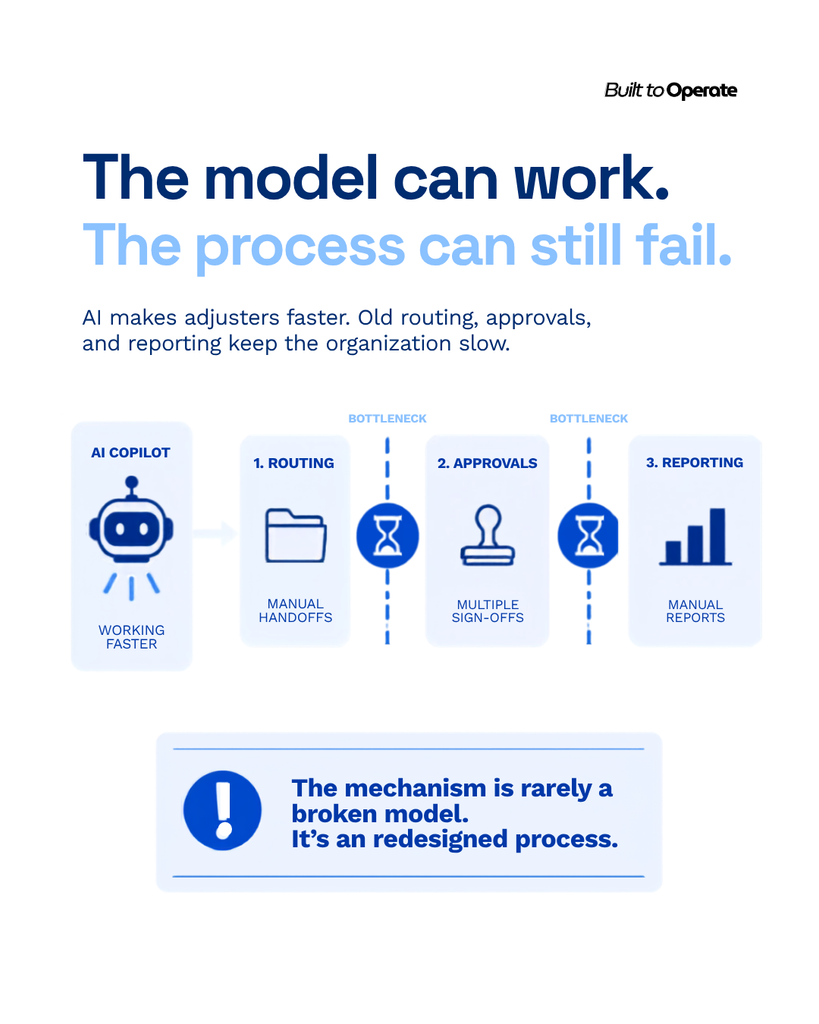
Picture a mid-sized insurance claims operation, something in the 300 to 400 employee range, running an AI copilot across its adjusters. Every adjuster genuinely files claims faster; that part shows up in individual time logs within weeks. But the intake process still routes every claim through the same three approval steps designed back when reviews were the bottleneck. The finance team still reports headcount-hours as the primary cost metric, because nobody rebuilt the reporting model around the new capacity. Six months in, adjusters are faster, the org chart is unchanged, the approval queue is unchanged, and the CFO is looking at a tool spend line with no matching line on the other side of the ledger. Nothing about that story requires the AI to be bad. It requires the process around the AI to still be old.
That composite is not a specific company; it’s a shape that shows up across the underlying survey data in industry after industry. The mechanism is rarely a broken model. It’s an unredesigned process wrapped around a model that works fine on its own.
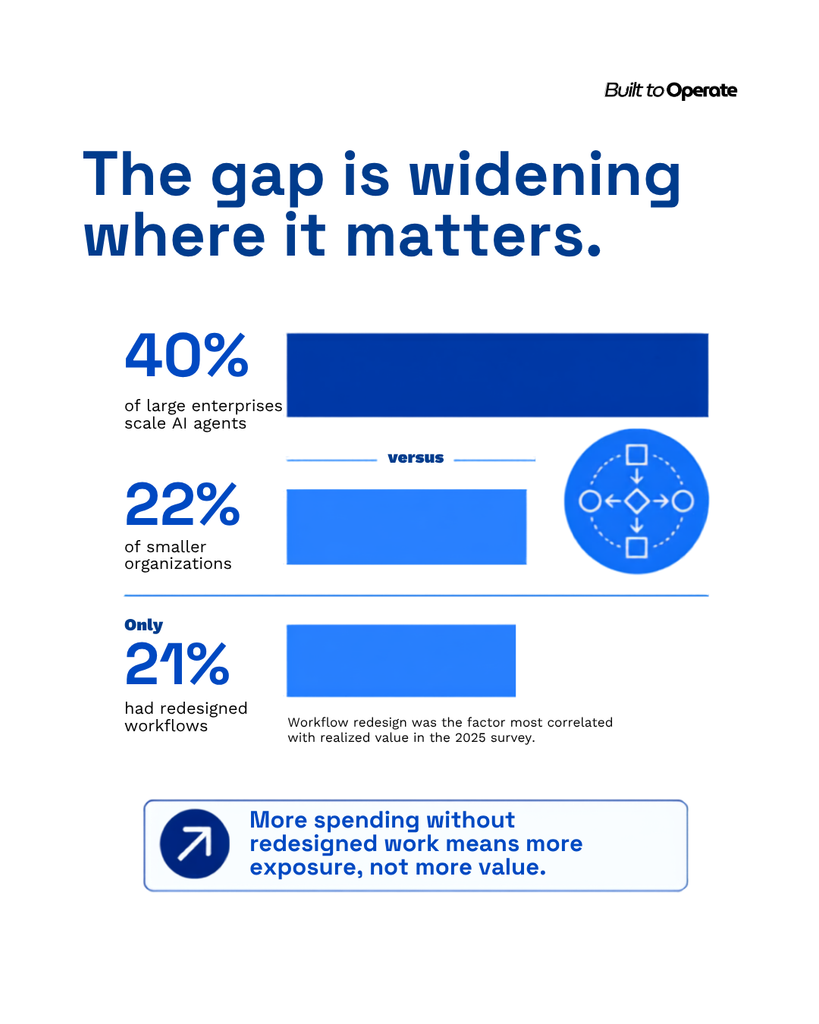
Size makes this worse before it makes it better. Large enterprises are scaling agents at nearly double the rate of smaller organizations (40% versus 22%), which means the companies spending the most are also the ones with the most exposure if that spending isn’t translating into results. A widening scale gap on top of a flat value gap isn’t neutral; it’s a compounding one. The dollars at risk this year are larger than the dollars at risk last year, even though the ratio of usage to return looks the same on a chart.
To its credit, McKinsey’s own research team doesn’t oversell this. Its 2026 report states plainly that it cannot isolate a single causal recipe for AI returns; high performers differ from everyone else across several dimensions at once, including investment level, deployment approach, leadership involvement, risk management, and workflow redesign, and the survey can’t cleanly separate which of those matters most.
But the 2025 wave of the same survey series did surface one number worth carrying forward: workflow redesign was the single factor most correlated with realized value, and only 21% of organizations had actually done it. Everyone else had, in effect, bolted AI onto a process built for a world without it. That’s not a small detail. It’s arguably the mechanism this whole gap runs through.
If you want the deeper diagnostic version of this, not just the headline number, the AI Readiness Assessment Complete Toolkit walks through scoring, gap profiling, and a 90-day roadmap built around exactly this kind of value-capture question.
This data can’t tell any individual reader whether their own organization sits in the 6% or the 94%. A cross-sectional survey shows correlation, not a guaranteed mechanism, and McKinsey says as much itself. If your organization has already redesigned the workflows AI touches, tied usage to a specific financial target, and has leadership actively tracking the number, this gap may simply not be your problem. The pattern describes an average. Averages hide a lot of individual exceptions in both directions.
It’s also worth saying plainly, in the spirit BTO tries to hold to when the news is genuinely mixed: this isn’t a story about AI not working. Eighty percent of people reporting real personal productivity gains is not nothing. It’s a story about the gap between a tool working for a person and a tool working for a company, and that gap doesn’t close by itself.
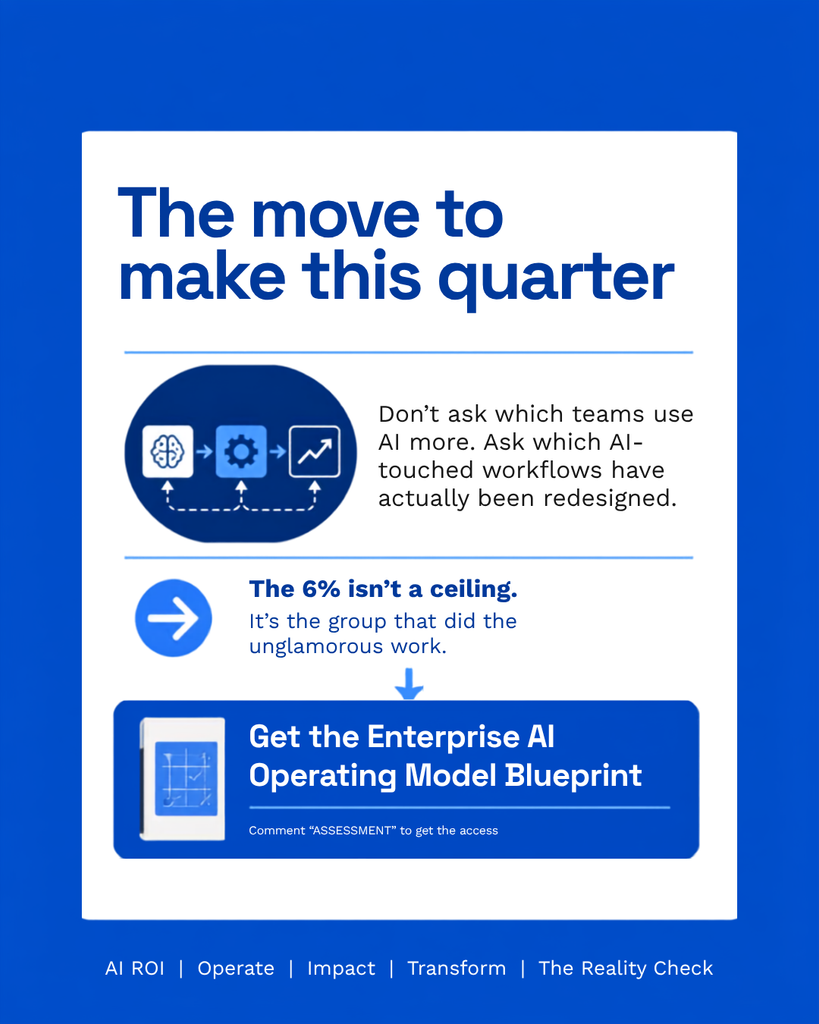
If usage is up and the return isn’t, the useful question isn’t “should we use AI more.” It’s “which of the workflows we’ve touched with AI have we actually redesigned, versus just handed a new tool to and left the process alone.” That’s an answer a director-level review can actually produce this quarter, not a five-year transformation plan. For teams that want the standalone methodology to run that review, rather than building a scoring model from scratch, the AI Readiness Assessment Guide covers the same six-dimension framework on its own.
Two BTO pieces are directly useful here too: our guide to assessing organizational AI readiness walks through exactly this kind of audit, and the maturity-based roadmap is useful for sequencing what to fix first once you’ve found the gap. There’s also a people side to this that shows up in where AI hiring is actually concentrated right now, since workflow redesign and role redesign tend to move together, not separately.
Once you’ve found the workflows that need rebuilding rather than just re-tooling, the Human-Machine Collaboration Handbook is free and built for exactly that next step: task-level redesign, not another dashboard measuring how much AI got used this month.
The 6% figure isn’t a ceiling. It’s just the current size of the group that did the unglamorous part of the work.